How To Do YOY or MOM Comparisons on Google Analytics
But perhaps a more useful tool is Google Analytics' ability to compare data from two different periods. Being able to compare and contrasts data from the current year with last year, this month and last month, or present quarter to past quarters can give you the information you need about the seasonal success of your website and the behavior of your users.
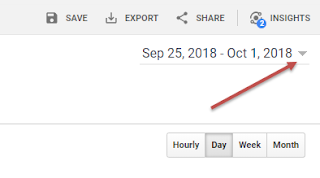
To set up this comparison for any of the Google Analytics reports, you must give it the ranges for which to pull data. To allow for range customization and comparison, set the first date range, check the "Compare to" box, and enter the second range. Lastly, select "Apply."
For this specific example, we will be doing a year on year (YOY) analysis of Google Analytics Mobile Overview report. To access this report, locate the "Mobile" subcategory under "Audience" on the left-hand menu and select "Overview." Customize your range to reflect the dates you want to include data from. In my example, I want to analyze the Mobile overview report from September 3, 2017, to October 1, 2018, with data from August 5, 2016, to September 2, 2017.
After I apply my changes to the dates, Google Analytics gives back a visual report of the data between both ranges, as well as a more thorough breakdown of information comparing both data ranges.
As the images show, the default setting is to show the data per day. You are also able to change this metric and have the data displayed by week or by month.


