Creating a Dashboard on Google Analytics

A dashboard is a collection of different specific reports you can find through Google Analytics from all main report pages. Creating a dashboard may save you some time by having the top 12 (maximum number of widgets you can have per dashboard) reports you want access to on a week-to-week basis.
To create a dashboard click on "Customization" on the left-hand menu and select "Dashboards." After the dashboards screen opens, select "Create" to make a new dashboard. Google Analytics gives you two different options when creating a dashboard: a "Blank Canvas" or a "Starter Dashboard."

A blank canvas will allow you to choose any metric with different dimensions (called widgets). With a starter dashboard, Google Analytics will automatically pull up the most popular widgets. For this example, we'll use a started dashboard. All widgets are editable and again, you can have up to 12 widgets. Name your dashboard and click on "Create Dashboard."
Google Analytics will automatically set the date range to one week. You can edit the date range like with any other report. Google Analytics also sets the data shown to be that of "All Users." You can filter this data by adding a segment. To add a segment, simply click on "+ Add Segment."

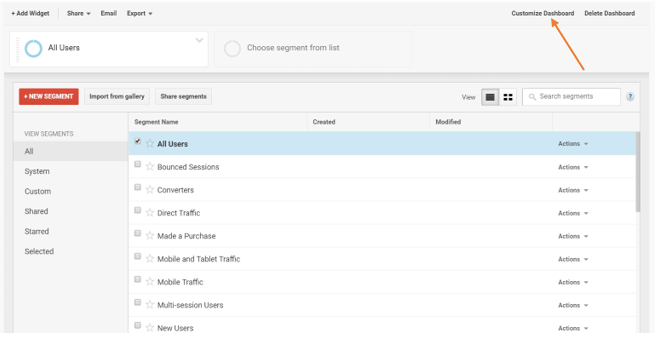
To edit the layout of your dashboard, select "Customize Dashboard" on the top right corner, underneath the date range section.
Google Analytics's default layout option is 50% - 50%, but this is customizable. You can choose from the options depicted below on the "Layout options" window.

To add a widget, click on "Add Widget" at the top of the page. You can choose a metric by clicking the drop-down list. You change the way the data is displayed from a metric to a timeline, geo map, table, pie chart, or bar chart.


To get more detailed data, you compare two metrics and add dimensions on most metrics. Once you've decided on the metric(s) and dimensions to show your widget, hit the "Save" button.


To edit a widget, simply hover your mouse over the widget you want to edit. A pencil icon will appear on the top right corner. Click on the "edit" button to edit the widget.

Once you are satisfied with the way your dashboard looks and the data it will provide, you can export the dashboard report as a PDF, send it with via email (this could be your own email or to share to someone else), or share as an object or template link.

